



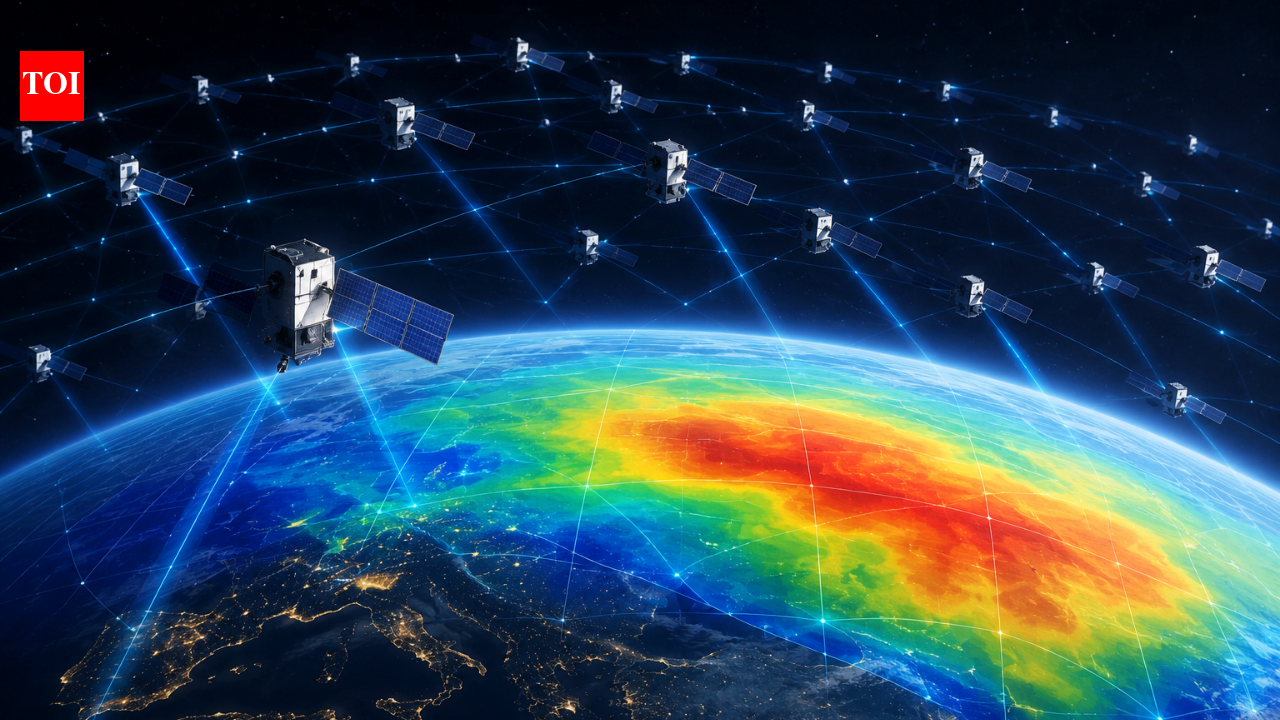
A network of Starlink satellites designed primarily for internet connectivity is giving scientists a new way to study one of the hardest-to-observe regions of Earth’s atmosphere. According to a study by researchers at Kyoto University, publicly available orbital data from roughly 1,200 Starlink satellites were used to estimate the density of the thermosphere at an altitude of about 482 kilometres. By analysing slight orbital changes caused by atmospheric drag and applying a mathematical technique called tomography, the researchers produced a two-dimensional map showing how thermospheric density varies across different parts of the planet.
Studying a difficult region
The thermosphere extends from roughly 100 to 1,000 kilometres above Earth’s surface. Although the atmosphere is extremely thin at these heights, it still contains enough gas to produce drag on satellites travelling through low Earth orbit. That drag gradually changes spacecraft orbits, making atmospheric density an important factor in predicting satellite movement. However, obtaining detailed measurements of thermospheric density over large geographic areas remains challenging. The Kyoto University team sought to address that problem by using satellites already operating in orbit rather than deploying a dedicated atmospheric-monitoring constellation.
Starlink becomes a sensor
The researchers examined publicly available orbital information for approximately 1,200 Starlink satellites operating at around 482 kilometres altitude. The method relies on atmospheric drag. As a satellite moves through the extremely thin thermosphere, gas particles create resistance that gradually affects its orbit. By analysing this orbital behaviour, scientists can estimate the density of the atmosphere surrounding the spacecraft.Instead of examining the satellites individually, the researchers combined measurements from the constellation. Because the satellites travel along different orbital paths, their movements provide observations from many parts of Earth. The team then applied tomography, a technique commonly used in medical imaging to reconstruct structures from measurements collected from different directions. In this case, the researchers used satellite orbital information to reconstruct the geographic distribution of thermospheric density.
Creating an atmospheric map
The analysis produced a two-dimensional latitude-longitude snapshot of thermospheric density at approximately 482 kilometres above Earth. This is significant because the researchers’ earlier work had used Starlink’s Two-Line Element, or TLE, orbital data to examine how thermospheric density changed with time and altitude. The new research adds a horizontal dimension, allowing scientists to examine geographic variations in density.The researchers also compared their results with observations from the European Space Agency’s Swarm satellites. The density patterns derived from the Starlink data showed strong consistency with the Swarm observations, providing an independent check on the technique.
Why atmospheric drag matters
Thermospheric density changes in response to solar activity and other processes. When density increases, satellites experience greater atmospheric drag; when it decreases, the drag becomes weaker. Even relatively small changes can affect spacecraft trajectories. This is increasingly important as low Earth orbit becomes more crowded with active satellites, inactive spacecraft and debris.Better measurements of atmospheric density could therefore improve models used to predict satellite motion and help reduce uncertainties in collision-risk assessments. The method could also eventually contribute to near-real-time monitoring of atmospheric density around satellites, although this remains a potential future application rather than an established capability.
Turning commercial data into science
The research highlights an unusual scientific opportunity created by large commercial satellite constellations. Starlink satellites were not designed to function as atmospheric probes, but their orbital behaviour contains information about the environment through which they travel.Using existing spacecraft could allow researchers to gather atmospheric observations without launching a separate network of scientific satellites. As the number of spacecraft in low Earth orbit continues to increase, similar approaches could potentially provide additional information about the upper atmosphere. The research could also have potential applications in space-weather research and spacecraft operations.
A new view of the upper atmosphere
The study, “Tomography of thermospheric density from Starlink Ephemeris: initial report,” was published in the peer-reviewed journal Earth, Planets and Space. The research builds on the team’s earlier work demonstrating that Starlink orbital data could be used to estimate changes in thermospheric density. The latest study takes that idea further by using a much larger set of orbital information to create a geographic map of the upper atmosphere. For scientists studying the thin atmosphere hundreds of kilometres above Earth, the growing satellite population may therefore offer an unexpected resource. Spacecraft are not simply moving through the thermosphere; they can also provide clues about the environment affecting their own journeys.


