


 merges with Congress-led front in NMC | Nagpur News")


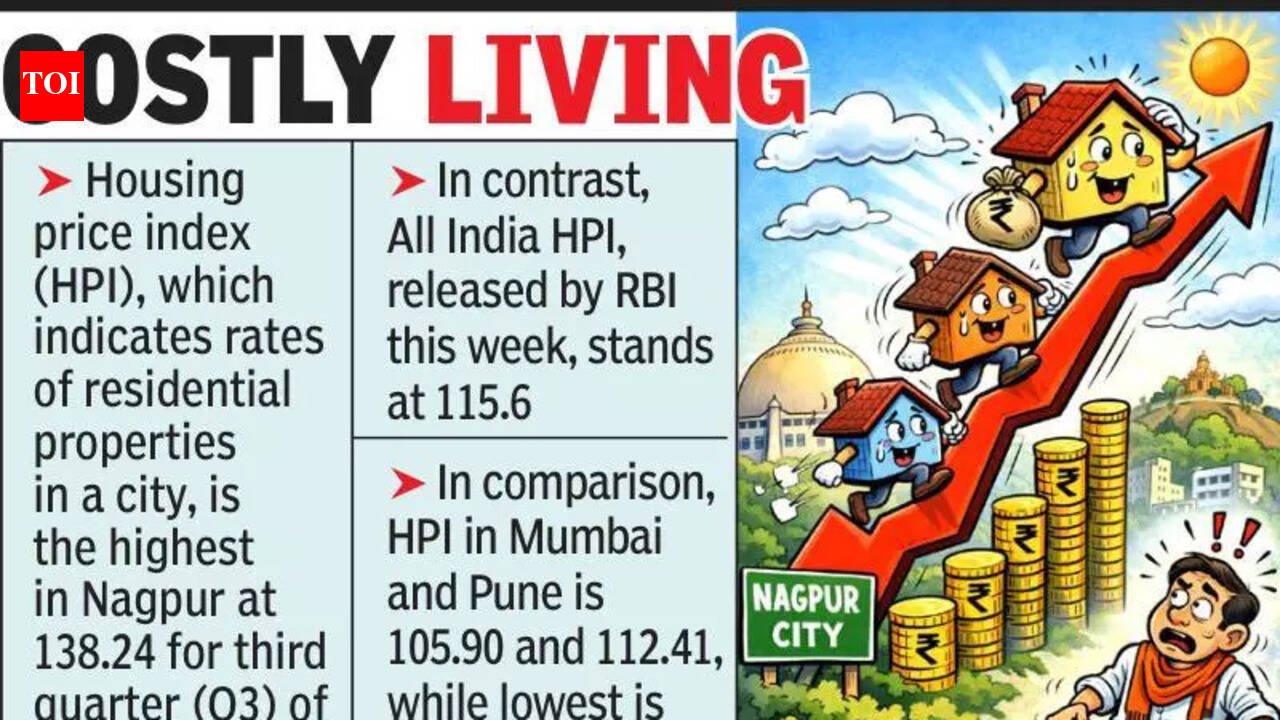
The overall growth in the All India index is driven by Nagpur, along with Chandigarh and Jaipur, the RBI report released this week said. The RBI takes into account trends in 18 major cities across the country, including Mumbai and Pune in Maharashtra.The RBI took 2022-23 as the base year. The HPI for Nagpur was 98.08 in Q1 of 2022-23, and touched 138.24 in Q3 of 2025-26. It is a growth of nearly 3% compared to the previous quarter of the current fiscal. There were times when the index for Nagpur slipped. In Q1 of 2023-24, it was 115.64, which slipped to 97 in Q4 of the same year. In comparison, the HPI in Mumbai and Pune is 105.90 and 112.41, respectively. The lowest is Delhi at 101.26.Even as the HPI for Chennai is over 162, the rates of commercial properties were also covered for the city. The prices of commercial real estate are considerably higher than those of residential properties. As a result, if comparisons are made on the basis of purely housing prices, Nagpur is the highest, according to the RBI chart, a source said. The RBI calculates the index on the basis of stamp duty paid at the time of sale of properties, with their price mentioned in the document. This year, the state govt hopes to collect 1,800 crore as stamp duty. This means that, with a 5% basic stamp duty, the state expects property transactions worth at least 36,000 crore to happen in the city.Realtors attribute the rising prices to demand on account of recent developments. “The high demand due to govt projects is propelling the prices,” said former president of the Confederation of Real Estate Developer Association of India (CREDAI), Gaurav Agrawala.


 merges with Congress-led front in NMC | Nagpur News")


