


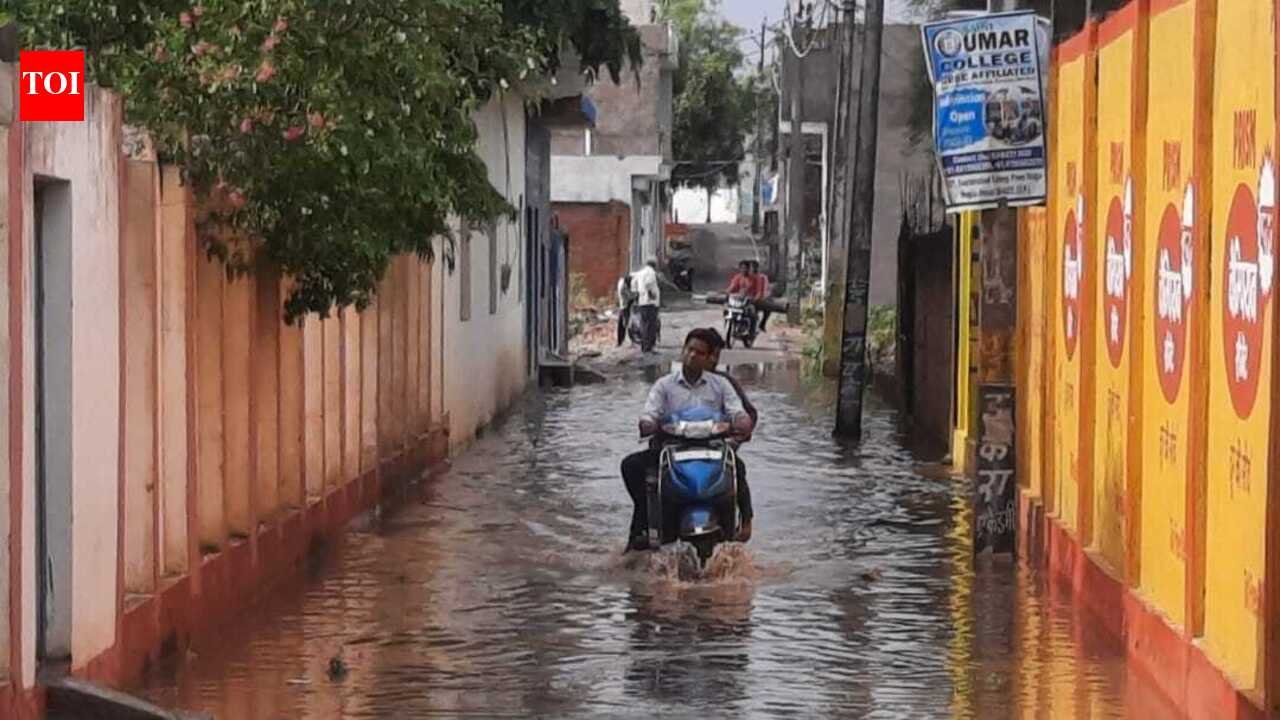
Jhansi: Amid a strong El Niño effect and an initially weak monsoon, Mahoba in Bundelkhand recorded Uttar Pradesh’s highest rainfall in the 24 hours from 8 am on Wednesday to 8 am on Thursday, receiving 131.6 mm, according to Regional Meteorological Centre, Lucknow.The rainfall was significantly higher than Mahoba’s average daily rainfall of 10.7 mm. With the latest spell, the district’s cumulative rainfall since June 1 has reached 730.4 mm, which is 56% above its normal cumulative rainfall of 469.4 mm.Gonda recorded the second-highest rainfall in the state at 54.5 mm during the same period, against its average daily rainfall of 6.6 mm. However, the district’s cumulative rainfall this year stands at 593.2 mm, about 11% below its normal cumulative rainfall of 670.2 mm.Jhansi and Badaun jointly recorded the third-highest rainfall in the state, with 46.8 mm each during the past 24 hours.Jhansi, however, continues to face a rainfall deficit. The district has received 443.9 mm of cumulative rainfall since June 1, against its normal rainfall of 554 mm, reflecting a shortfall of around 20%.Jhansi has been experiencing intermittent rain since Tuesday night, with periods of drizzle punctuated by heavy showers. The rainfall has brought relief to the region’s water bodies, helping fill dams that were running below their normal levels.However, the continuous rain has also disrupted normal life in the city.Several parts of Jhansi have been inundated due to choked and encroached drains, with water entering numerous houses. The old walled city has been among the worst affected, with several residents living in old and vulnerable buildings.Schools were declared closed as rainwater accumulated on roads, with commuters struggling through knee-deep water at several locations.Waterlogging was also reported from rural areas of the district, where rainwater seeped into houses.In Gonda, meanwhile, the cumulative rainfall has crossed the normal mark by around 7%, despite the district recording a deficit when compared with its cumulative seasonal average in the figures cited above.
